21verified prop firms
The trading intelligence layer for the prop firm world
Compare firms, track rule changes, follow real trader feedback, and stay on top of the stories shaping the prop industry from one command center.
Showing 19 prop firms.
| ASSETS | PLATFORMS | MAXALLOCATION | BEST CURRENTPROMO | ACTION | ||||
|---|---|---|---|---|---|---|---|---|
4.6 4 reviews | 2 | ForexCryptoIndicesCommodities | $200K | 15% OFF | ||||
4.5 11 reviews | 5 | ForexCryptoIndicesCommodities | $200K | 25% OFF | ||||
0.0 0 reviews | 1 | ForexCryptoIndicesCommodities | $300K | 5% OFF | ||||
0.0 0 reviews | 3 | CryptoMetalsForexCommodities | $400K | 33% OFF | ||||
0.0 0 reviews | 2 | ForexCryptoIndicesCommodities | $600K | 25% OFF | ||||
4.7 4 reviews | 10 | ForexCryptoIndicesCommodities | $250K | 5% OFF | ||||
4.7 5 reviews | 4 | ForexCryptoIndicesCommodities | $200K | 9% OFF | ||||
4.6 7 reviews | 3 | ForexCryptoIndicesCommodities | $100K | 8% OFF | ||||
4.6 1 reviews | 3 | ForexCryptoIndicesMetals | $400K | 15% OFF | ||||
4.5 4 reviews | 3 | ForexCryptoIndicesMetals | $100K | 5% OFF | ||||
4.5 4 reviews | 4 | ForexCryptoIndicesMetals | $400K | 5% OFF | ||||
4.2 1 reviews | 10+ | ForexCryptoStocksIndices | $200K | 6% OFF | ||||
4.0 1 reviews | 5 | ForexCryptoStocksIndices | $200K | 10% OFF | ||||
3.6 1 reviews | 4 | ForexCryptoIndicesMetals | $200K | 10% OFF | ||||
0.0 0 reviews | 8 | ForexCryptoIndicesMetals | $100K | 10% OFF | ||||
0.0 0 reviews | 2 | IndicesCommoditiesMetalsForex | $500K | 10% OFF | ||||
0.0 0 reviews | 3 | ForexIndicesCommoditiesMetals | $400K | 10% OFF | ||||
0.0 0 reviews | 3 | ForexIndicesCommoditiesMetals | $100K | 15% OFF | ||||
0.0 0 reviews | 3 | ForexCryptoIndicesCommodities | $200K | 10% OFF |
Why using our services?
AVG
$1.3B
$975M
$650M
$325M
$0
Real payout data
$1.3B+ in tracked payouts. No marketing claims. Just real trader results.
Search verified reviews...
FTMO
Verified review result
Verified signal, not noise
Reviews backed by proof. No fake hype. No paid bias.
1
Tradeify
21,100 payouts
$34.6M
2
MyFundedFutures
6,914 payouts
$11.6M
3
Funding Pips
12,246 payouts
$10.6M
See who actually pays
Track performance across firms. Know where traders win - and where they don't.
i
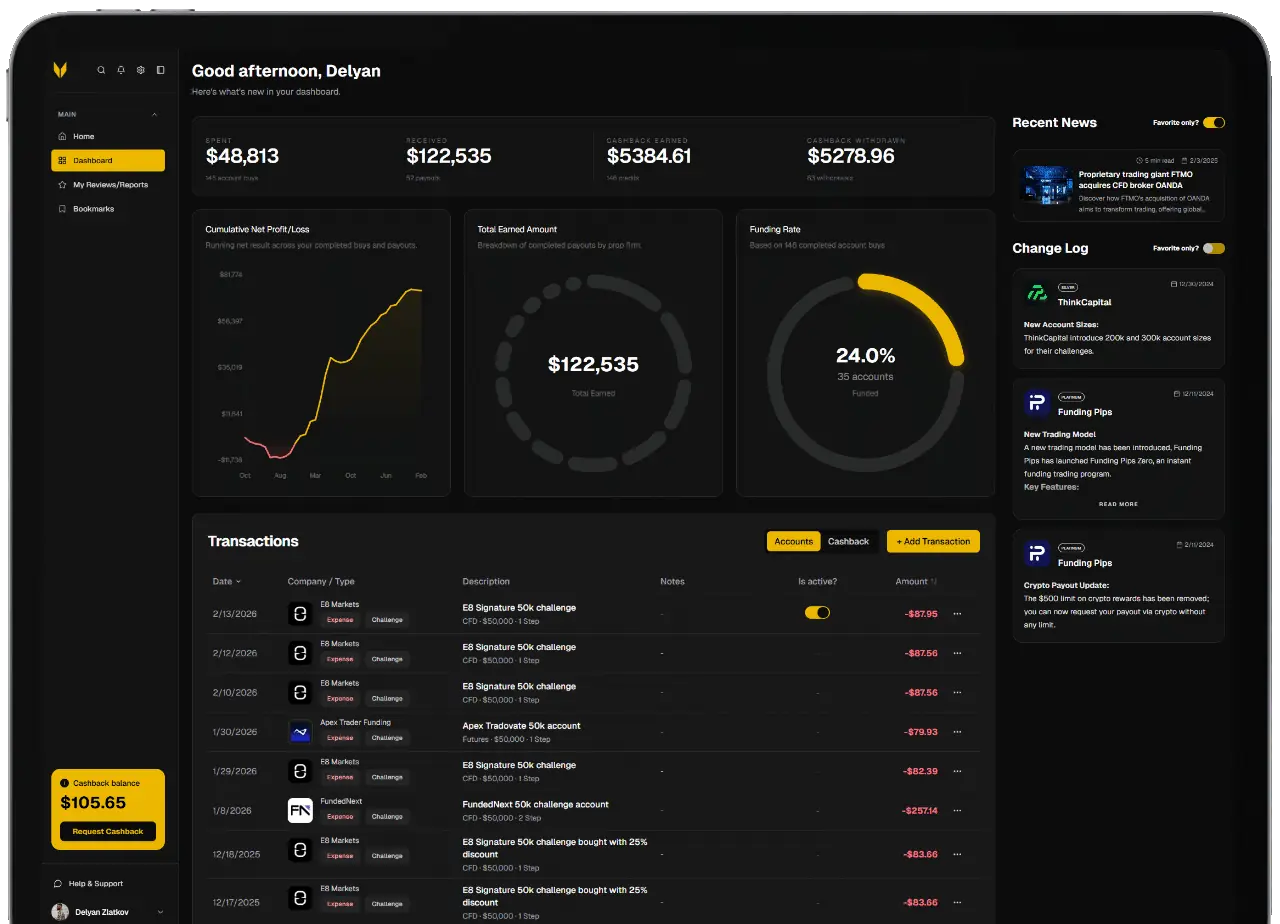
Cashback balance$126.40
+$18.00 pendingEarn while you use it
Leave a review, buy a challenge, unlock cashback. Contribute - get rewarded.
32%
8 accounts
Funded
68%
17 accounts
Failed
32%
Funding Rate
Built for execution
Tools, data, and insights - designed for traders who actually take money out of the market.
Diamond
FTMO
70
4.2
1 reviews
10+
ForexCryptoStocksIndices
Platinum
E8 Markets
68
4.5
4 reviews
4
ForexCryptoIndicesMetals
Compare before you commit
Shortlist firms by rules, pricing, platforms, reviews, and payout history before you spend.
Ready to Elevate Your Trading?
Join hundreds of traders who are already using Chart Nomads to compare prop firms easily, find offers and collect cashback.